Fatty Acid analysis by gas chromatography
|
Principle |
|

|
The discovery in the mid-1950's of gas-liquid chromatography
(GLC or in short GC) has revolutionized the analysis of fatty acids and,
undoubtedly, this technique is the most frequently used. It remains one of the
most powerful analytical procedures for separating and analyzing the properties
of any acylated lipids, especially when combined with techniques which can be
used to identify the chemical structure of the peaks, e.g., mass spectrometry
or NMR. A chromatographic analysis involves passing a mixture of the molecules
to be separated through a column which contains a matrix capable of retarding
the flow of the molecules. Molecules in the mixture are separated because of
their differing affinities for the matrix in the column. The stronger the
affinity between a specific molecule and the matrix, the more its movement is
retarded, and the slower it passes through the column. Thus different molecules
can be separated on the basis of the strength of their interaction with the
matrix. After being separated by the column, the concentration of each of the
molecules is determined as they pass by a suitable detector (e.g., UV-visible,
fluorescence, or flame ionization). Chromatography can be used to determine the
complete profile of molecules present in a lipid. This information can be used
to: calculate the amounts of saturated, unsaturated, polyunsaturated fat and
cholesterol; the degree of lipid oxidation; the extent of heat or radiation
damage; detect adulteration; determine the presence of antioxidants. Various
forms of chromatography are available to analyze the lipids in foods, e.g. gas
chromatography (GC), high pressure liquid chromatography (HPLC), thin layer
chromatography (TLC).
|
Preparation |
|
|
Intact triacylglycerols and free fatty acids are not very
volatile and are therefore difficult to analyze using GC (which requires that
the lipids be capable of being volatized in the instrument). For this reason
lipids are usually derivitized prior to analysis to increase their volatility.
Triacylglycerols are first saponified which breaks them down to glycerol and
free fatty acids, and are then methylated.
|
ethanol |
|
| Triacylglycerol |
-----------------> |
Fatty acid methyl esters (FAMEs) +
methylated glycerol |
|
Separation by GC |
|
|
Fatty acids are the group of lipids most commonly analyzed by
GLC. This method is applicable to biological samples containing compounds with
chain length in the range C14 to C24.
GLC analysis of fatty acids is
performed following their conversion to apolar, methyl ester derivatives.
Columns with polar phases are used, as polyethylene glycol stationary phase
(Carbowax), to coat capillary column. The majority of commercially available
columns are coated with phases bonded or immobilized on the sillica column
wall. This technology leads to a great durability with a strong thermal
stability.
Analytical conditions must be adapted from published values to
obtain reliable and precise results. The temperature gradient program is the
main parameter to be modified according to the nature of the column and the
complexity of the fatty acid mixture.
| The identification of a peak can be made from
its retention time but must be confirmed by other investigations such as TLC
mobility, column fractionation or GC-MS. In practice, it is convenient to work
not with retention time which is temperature and gas flow rate dependent, but
with retention time relative to that of a suitable standard (stearic acid
present in all samples is the most convenient). The logarithm of the relative
retention time and the number of carbon atoms is linearly related and may be of
some help to identify unknown fatty acids. A plot of these parameters with
homologous series of saturates, monoenes, dienes, trienes, etc. gives a series
of parallel lines. |
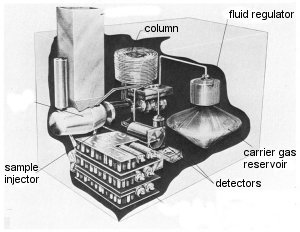 |
| Cut-open illustration of a gas chromatograph |
|
 |
| Scheme of a gas chromatograph |
|
Only the principle of this determination is presented here (as
an example we restrict the demonstration for peaks situated between palmitic
and stearic acids): if t16:0 is the retention time of palmitic acid
and t18:0 is the retention time of stearic acid and ti
the retention time of the unknown peak, the ECL value of this peak is
calculated as : 100 x [[(18-16) x (log ti - log
t16:0)/(log t18:0 - log t16:0)] + 16].
 |
| Chromatogram of the fatty acid profile from a green algae
(Enteromorpha sp). Notice the presence of 17:0 as an internal standard, and the
three unusual plant fatty acids: 16:2n-6, 16:3n-3 and 16:4n-3 |
|
Quantitation and expression of
results |
|
|
The lipidologist must be aware of the non exact linearity of
the detector response to the fatty acid mass. The responses of the detector
used should be checked with a calibrated standard mixture. This correction is
more important in studies concerning highly unsaturated fatty acids that are
often prevalent in marine products.
Peak areas are now measured with an
electronic integrator, this is the most accurate and convenient procedure.
Nevertheless, the lipidologist must be aware of the limitations of his
integrator and, the use of an adapted chromatographic software is highly
recommended to verify the integration process.
Results are frequently
expressed as weight percent, this is currently used in nutrition works. In
biochemical studies, as for membrane structure, results should be expressed on
a molar percentage basis.
|